PrivateCircle
Privatecircle — Insights
2025
Overview
PrivateCircle Research provides deep company intelligence across MCA filings, ratings, equity deals, lenders, sectors, and financial activities. One of the major challenges users faced was understanding large amounts of company data quickly without opening multiple listing pages manually.
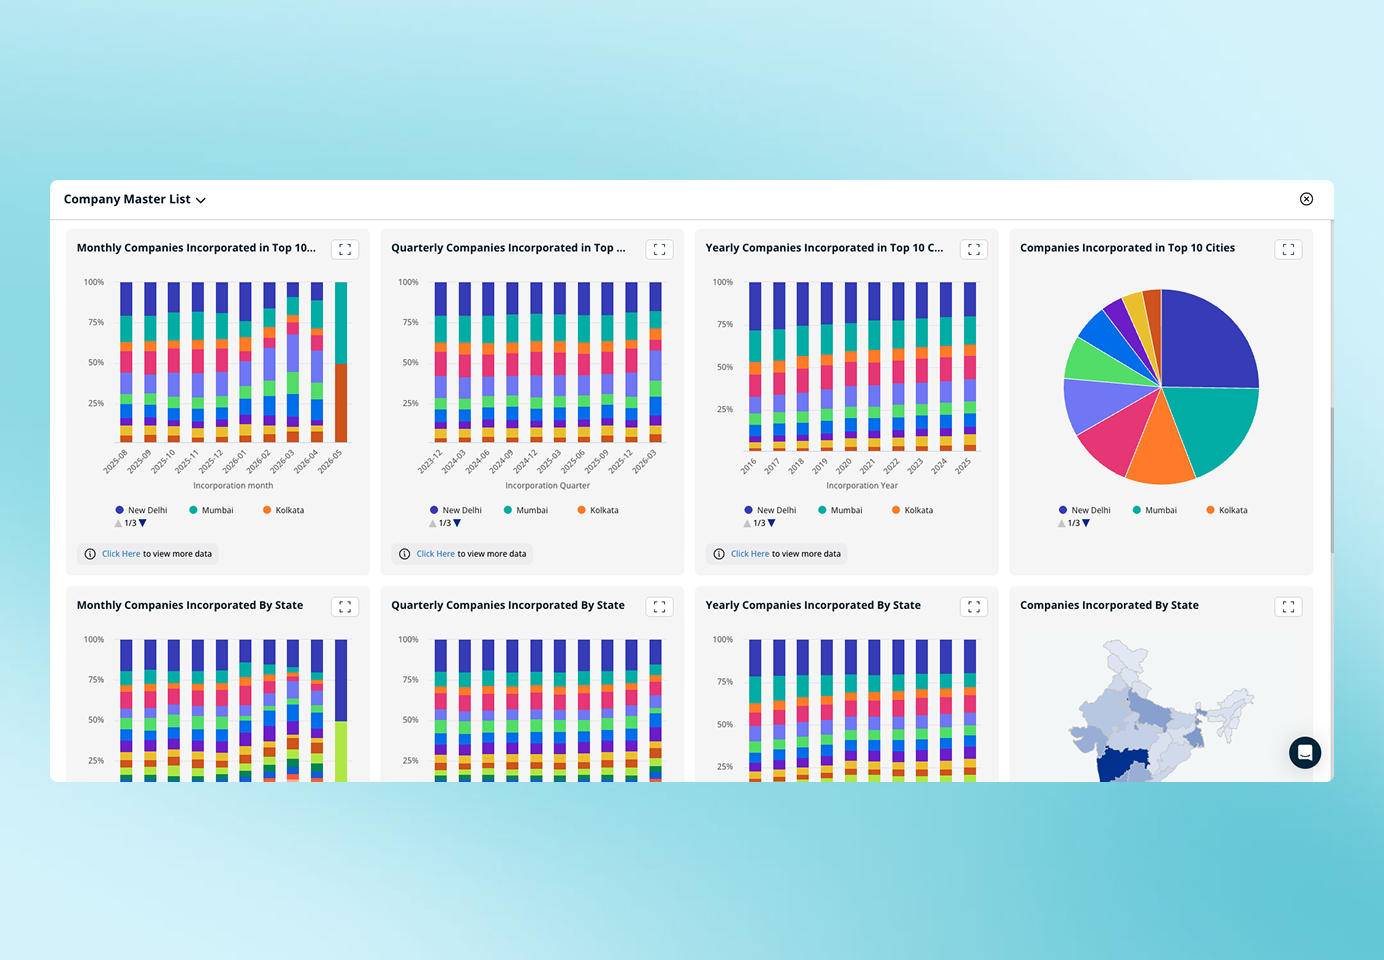
To solve this, I designed the Insights module, a graph-driven analytics experience that converts complex financial and company datasets into visual insights for faster decision making. The module allows users to analyze company incorporations, equity deal activity, debt charge data, ratings trends, sector-wise analysis, geographic insights, revenue and EBITDA distributions, and quarterly, monthly, and yearly comparisons, while also enabling users to continue exploration into detailed company listings.
Problem
Most users were financial analysts, researchers, investment professionals, and senior decision makers. The majority of users were in the 35 to 70 age group, and many users preferred quickly scannable insights over dense tables.
During user discussions, I found several recurring problems:
- Large datasets were difficult to interpret quickly.
- Existing tables created cognitive overload.
- Users wanted visual trend analysis.
- Users needed to carry filters across multiple modules.
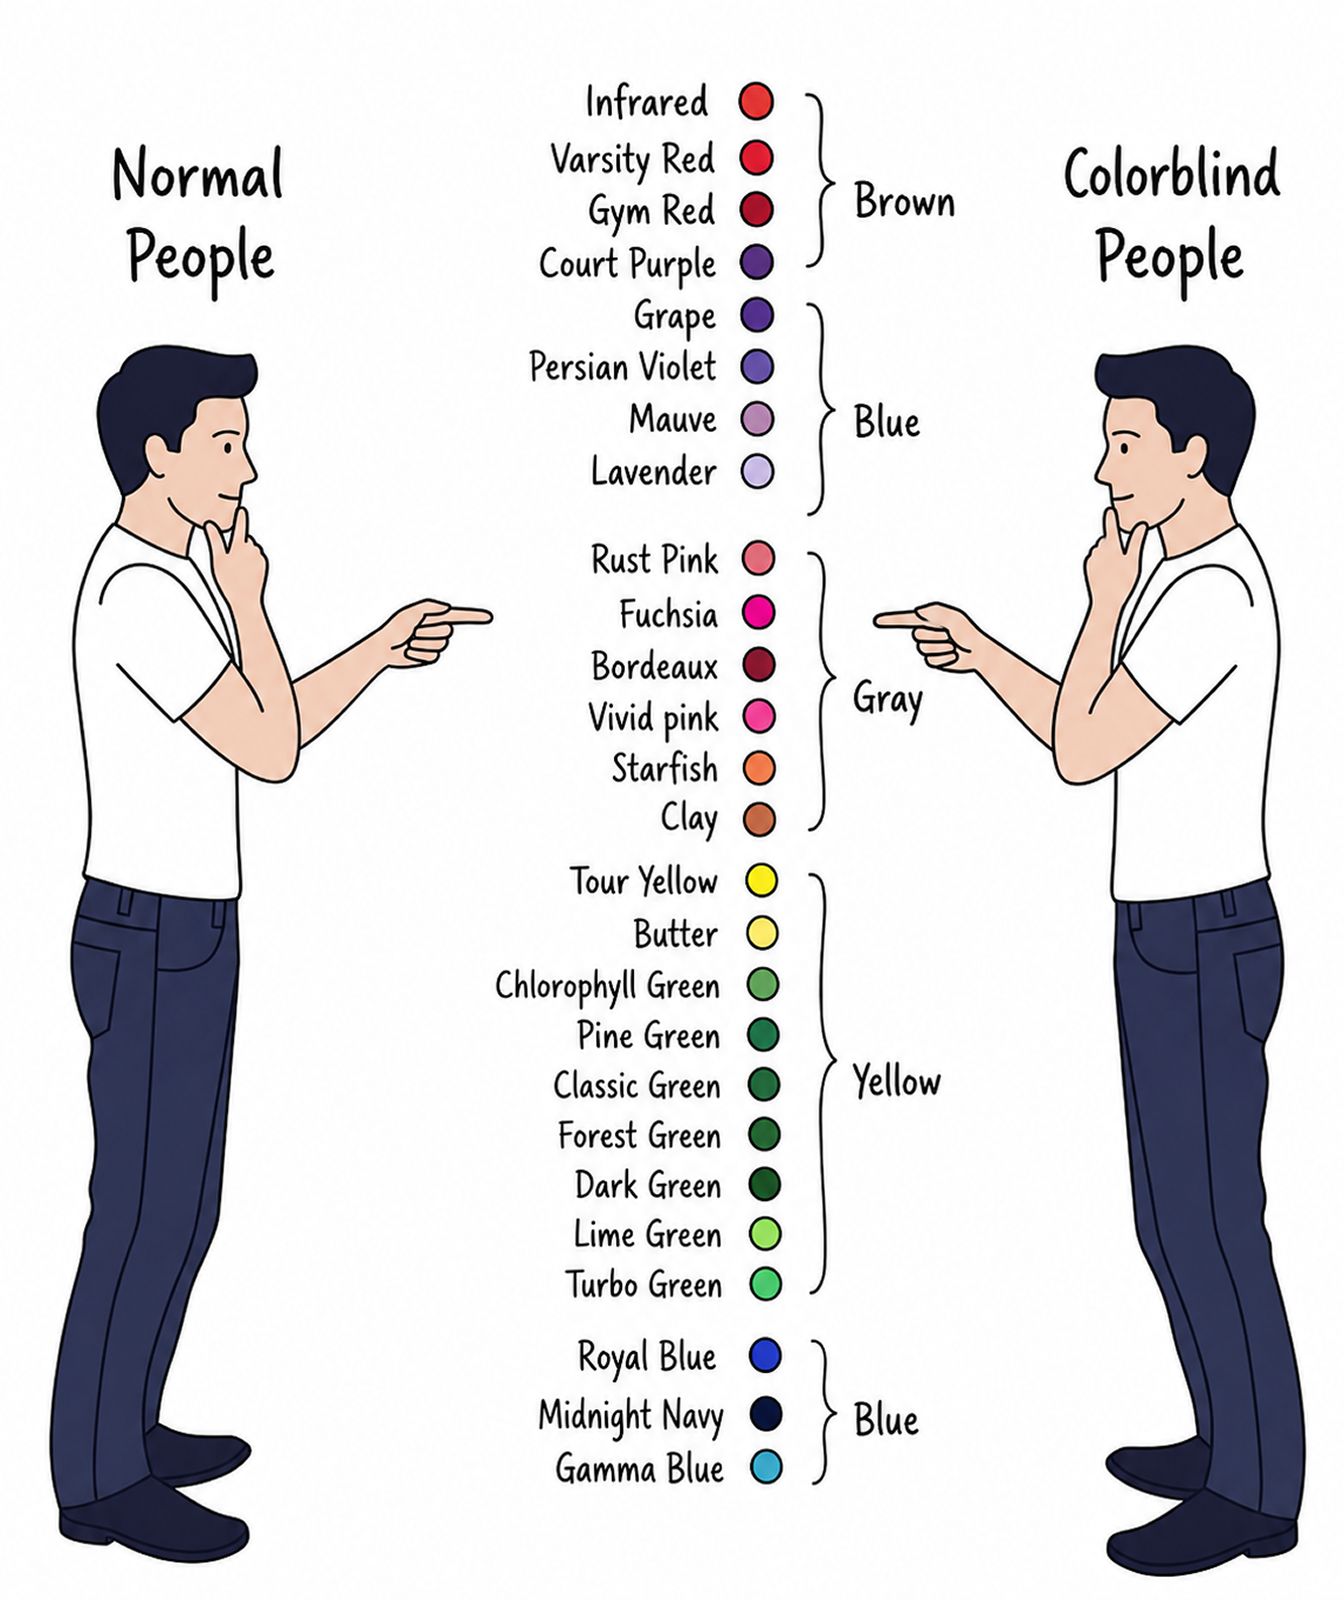
- Color-heavy charts became difficult for color-blind users.
- Dense dashboards reduced readability for older users.
Users also requested filtering by state, city, revenue, PAT, EBITDA, sectors, ratings, and company types, seamless transition from insights to detailed company listings, and comparison across monthly, quarterly, and yearly views.
Goal
Design an insights experience that simplifies complex financial datasets, improves readability for older users, supports accessibility and color blindness, helps users identify trends quickly, reduces effort required to navigate between datasets, and enables drill-down workflows into listing pages.
Research & Discovery
I spent time understanding how analysts scan dashboards, how users compare trends, accessibility limitations in financial dashboards, how color blindness impacts graph interpretation, and which chart types are easier to understand for non-design-heavy users.
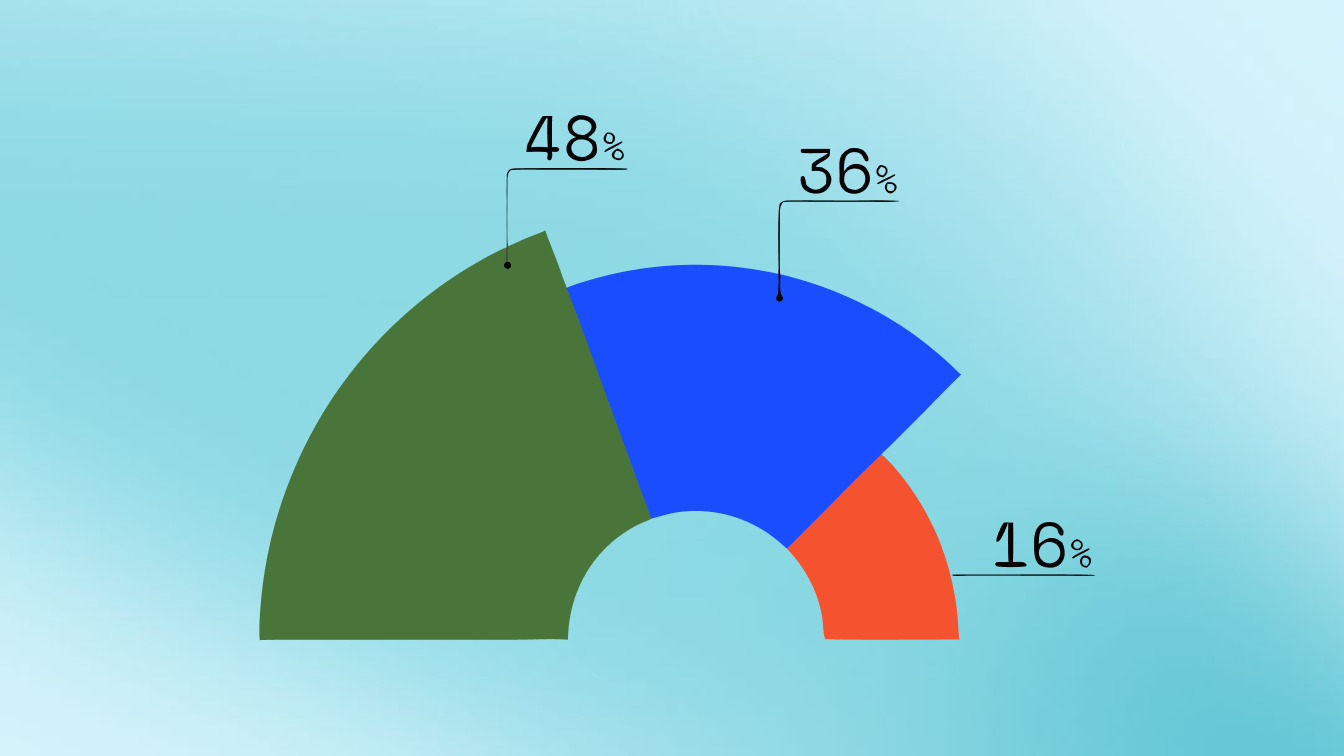
One key learning was that users relied heavily on pattern recognition rather than reading every value individually. This influenced chart hierarchy, spacing, color selection, label visibility, graph density, and interaction patterns.
Accessibility & Color Blindness
A major focus during the design process was ensuring charts remained understandable for users with color-vision deficiencies. Instead of relying only on color differences, strong contrast ratios were used, graph labels were prioritized, legends were simplified, chart spacing was increased, multiple visual distinctions were introduced, and overly saturated conflicting colors were avoided.
I researched palettes that remain distinguishable across different types of color blindness while still fitting the product's visual system. This improved readability, data differentiation, long-session usability, and visual comfort for older users.
Design Decisions
1. Multi-Level Insights Architecture
Users requested insights across different datasets: MCA, Profiled Companies, Ratings, Equity Deal Book, and Debt Charge Wise. I designed a scalable modular insight system where each module follows a consistent interaction and visualization pattern. This helped users learn the system faster, navigate between modules easily, and maintain context while analyzing data.
2. Time-Based Comparison System
Users frequently compared monthly, quarterly, and yearly patterns together. I designed reusable visualization structures so users could quickly identify growth, decline, seasonal patterns, and financial activity changes without relearning layouts.
3. Drill-Down Workflow
One important user request was that if they find interesting data in a graph, they should immediately access the related companies. To solve this, filters persist across workflows, insights connect directly to listing pages, and users can continue exploration into detailed datasets. This reduced repeated filtering effort and improved research efficiency.
4. Handling Dense Financial Data
To reduce overload in very large datasets, cards were grouped logically, visual hierarchy was improved, charts were separated based on task relevance, whitespace was intentionally increased, labels and legends were simplified, and expandable full-screen graphs were introduced.
Outcome
The Insights module helped transform complex financial research into a more visual and accessible workflow. Key improvements included faster trend recognition, improved readability for older users, more accessible graph interpretation, reduced navigation friction, scalable dashboard structure across modules, and better continuity between insights and company listings.
The final system became a core part of how users explored company activity, ratings, financial trends, investment patterns, sector analysis, and geographic insights inside PrivateCircle Research.